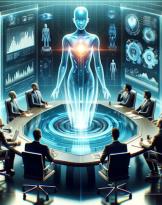
Cyberspace, intended as a new dimension in which man can interact (and, if necessary, make war), presents to those who try to understand it a great difficulty linked to the possibility of visualization. While the most well-known domains (land, sea, air and space) can rely on the different modes of representation, all born (or almost!) From graphic representations such as sketches, drawings and engravings, cyberspace can hardly be represented with a drawing.
Now, if the trajectory of a projectile can be represented by resorting to the third dimension and correlating the position data with time, as well as the course of an aircraft or the path of a tank, the representation of an object is quite different "hypothetical as a virus, a worm a zombie or similar.
The introduction of tools such as radar e Sound has guided the development of methodologies for displaying (almost) real-time monitors of various types of signals, collected through water or space.
The collection of additional data related to the objects present in the surrounding space has allowed the identification and representation, more and more realistic, of the battle space, transforming simple tools into decision aids.
The use of computer tools has allowed us to use maps and to georeference objects on them, how can it help us to represent cyberspace with its objects?
Are there visualization methods applicable to cyberspace? And most importantly, what information can be considered useful for "visualizing" cyberspace?
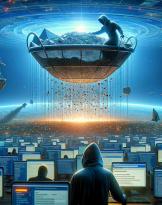
From a summary analysis it seems very difficult to use tools such as maps in common use, as it is also very difficult to "imagine" cyberspace (or rather, a portion of it) simply by reading graphs and log files related to a subnet and the activities that you it takes place.
Current technology allows us to collect millions of data in real time, to aggregate them, filter them and turn them into information, but despite everything, man and his experience remain the main element of this huge complex puzzle.
Everything would be simpler if there were a method to "visualize cyberspace in easily understandable graphical form and this is what a group of independent researchers is working on: Tim Bass, Richard Zuech, Robert S. Gutzwiller and Nicklaus A. Giacobe project authors "Cyberspace Situational Awareness".
In a recent article published on Researchgate.org on July 24, Khaterine Lindemann explains the work of Tim Bass's team to improve the way cyberspace activity is viewed in three dimensions in order to help cybersecurity experts identify the threats.
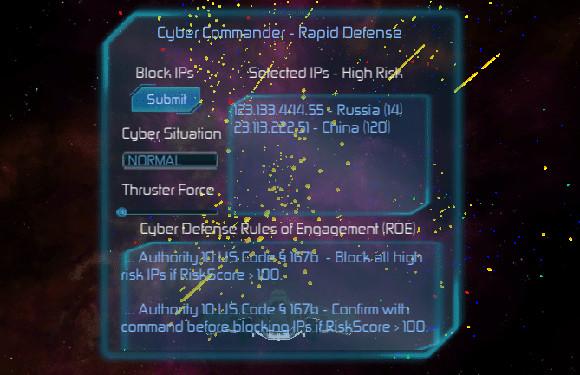
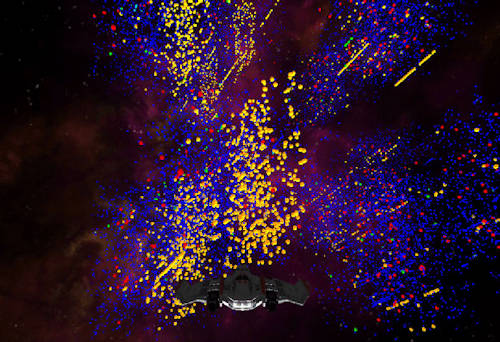 Bass and Zuech are working on the development of an IT tool that enables cyberspace visualization. To do this they started by encoding certain cyberspace objects, assigning them different colors depending on the level of risk assigned to them.
Using such an interface allows you to "browse" within cyberspace, surrounded by green or blue dots representing users connected or disconnected to servers, yellow dots representing non-dangerous activities and red points potential dangers such as users
from suspicious behavior.
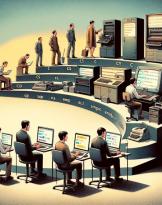
The display mode is similar to that used in some video games and is certainly more suitable for a young digital native, but even those who are used to analyzing long lists of lines of text (log files) or complex graphs will find the thing of a certain utility and intuitiveness.
According to Zuech the visualization of cyberspace is certainly less boring than reading long text files and would also allow different security analysts to work simultaneously on the same cyberspace sector and eventually collaborate if necessary.
It can also be assumed that different operators work simultaneously on the same portion of cyberspace using different display masks, as if one were looking at reality using binoculars and another, at his side, using an infrared device instead. The space is the same but the point of view is different and the information gathered is different.
According to the two independent researchers, the use of a graphic visualization tool in three dimensions would allow the analyst to better assess the potential risks and an analyst is certainly more reliable than the work done automatically by a .
It must be said that in any case the visualization performs operations on the available data that in some way can influence the analyst.
Surely Tim Bass is right when he says that: "We need human beings involved in the analysis activity to identify new and not yet known patterns".
Bass's idea stems from his experience as a military security consultant and now this idea is turning into reality.
You can follow the developments and get more information about the project at the link: project cyberspace situational awareness. Enjoy the reading!
To learn more:
https://www.researchgate.net/blog/post/researchers-render-cyberspace-in-...
https://www.researchgate.net/project/Cyberspace-Situational-Awareness
http://www.thecepblog.com/author/richard-zuech/;
http://www.richardzuech.com/